


Quantifying Crypticity
The Parental PopulationIn our first attempt at designing an evolutionary process, we began with a parental population of genomes that were chosen completely at random. We rapidly discovered, however, that randomly assembled populations invariably evolved to a uniformly gray phenotype. This undesirable property was a consequence of redundancies in our developmental genetics. Because the location of a patch, as well as its size, shape, and brightness, is specified as part of the patch locus, our system could produce identical phenotypes from very different genotypes. So breeding any two moths of identical appearance could result in blending inheritance, producing on average a gray moth, even in the absence of directional selection (Kamil & Bond 2001).
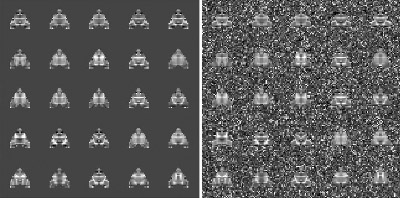
To obtain biologically realistic evolution, it was necessary to give the parental population a selective history, making genomes that were structured by common descent (Bond & Kamil 2002). As a template, we chose a moderately cryptic moth image from an earlier study (Moth #3 from Bond & Kamil 1998) and generated an initial population of fairly uniform appearance whose phenotypes showed no more than a threshold level of disparity from the template (in terms of taxonomic distance: Sneath & Sokal 1973). Genetic consistency was obtained by subjecting this population to multiple generations of template-based selection. At the beginning of each generation, the fitness of each phenotype was determined by its discrepancy from the template moth. Individuals were then selected to breed using a linear ranking algorithm (Bäck 1996). Moths with the highest fitness scores had roughly twice the probability of breeding as those with the lowest ones. The selective regimen was maintained until the mean disparity from the template, averaged over the entire population, was below a threshold value, which generally required about 90-100 generations. This process was repeated ten times, producing ten candidate populations with moderate phenotypic variance and an internally consistent genetic structure. The candidate population with the median level of phenotypic variance was chosen to serve as the parental population for the experimental runs. Below is a sample of moths from the parental population on uniform (left) and cryptic (right) backgrounds.
Reverse-Engineering the Background
In these studies, the moth stimuli were made hard to detect by generating backgrounds that corresponded, to some specified degree, to the distribution of pixel values in the moths. In essence, we reverse-engineered the background, making the bark resemble the moths. The degree of resemblance was controlled by creating random mixtures of pixels drawn from two distributions: one that derived from the moth stimuli themselves and a second, contrasting distribution that overlapped minimally with that of the moths.
A background in which 20% of the pixels were derived from the moth distribution and 80% from the contrasting distribution would be referred to as a Level 2 background, and the moths would be very easy even for humans to detect. At the other extreme, finding the prey on a Level 8 background, with 80% of the pixels drawn from the moth distribution, is exceedingly difficult for all but a few highly proficient blue jays. The selection experiments were all run with Level 3 or 4 backgrounds -- easy enough to allow the birds to wipe out very conspicuous mutants, but hard enough for hunting by searching image to produce a significant benefit.
After the background pixels were selected, we adjusted the texture or "grain" of the image by randomly adjusting the sizes of contiguous patches of the same gray-scale intensity level. This was accomplished by a simple iterative process, in which the program selected a pixel in the background at random and then changed it to match one of its neighbors. The process was repeated many times, until the distribution of patch sizes, measured with a flood-fiill algorithm, matched the distribution derived from the moth phenotypes.
Measuring Crypticity
John Endler (1984, 1990) suggested that the level of crypticity could be quantified by comparing the distributions of color patches in the organism and the background. Since the patch sizes for our virtual moths were constrained to mimic those of the background, the only variable that influenced prey crypticity was the relative distribution of pixel intensities. We were therefore able to develop a simple crypticity measure based on the average unsigned difference between the pixel distribution of a moth and that of the background. This Crypticity Index varied from about 0.2 for the most conspicuous moths to nearly 0.9 for the most cryptic ones.
Evidence that the index provided an adequate objective measure of background resemblance came from two analyses. In the first, we took a single population of 200 moths (the parental population for our study) and computed the distribution of their crypticity indices over the full range of background levels. As shown above, the results are approximately linear, as one would expect from the fact that each successively higher level of background difficulty is produced by increasing the number of moth-derived pixels by a constant percentage. The crypticity index thus faithfully reflected our algorithm for generating matching backgrounds.
Secondly, during the experimental trials, the crypticity index accounted for better than one-third of the variance in the detection accuracy of the birds. Although jays found most of the more conspicuous moths (with indices of less than 0.5), their performance declined rapidly with higher index values. The effectiveness of a particular level of crypticity depended, to some degree, on the average crypticity index for the entire population. Highly cryptic individuals derived less benefit in populations where most of the other moths were also cryptic (shown in red above) than in populations that were generally more conspicuous (shown in cyan). This is a reflection of a "search rate" (Guilford & Dawkins 1987) or "caution" (Bond & Riley 1991) effect. When the birds expect a difficult detection task, they search each display more persistently, increasing their chances of detecting a cryptic individual.
References from Other Sources
Bäck, T. (1996). Evolutionary Algorithms in Theory and Practice. New York: Oxford U. Press.
Endler, J.A. (1984). Progressive background matching in moths, and a quantitative measure of crypsis. Biological Journal of the Linnean Society 22: 187-231.
Endler, J.A. (1990). On the measurement and classification of colour in studies of animal colour patterns. Biological Journal of the Linnean Society 41: 315-352.
Guilford, T, & Dawkins, M.S. (1987). Search images not proven: A reappraisal of recent evidence. Animal Behaviour 35: 1838-1845.
Sneath, P.H.A., & Sokal, R.R. (1973). Numerical Taxonomy: The Principles and Practice of Numerical Classification. San Francisco: Freeman & Co.